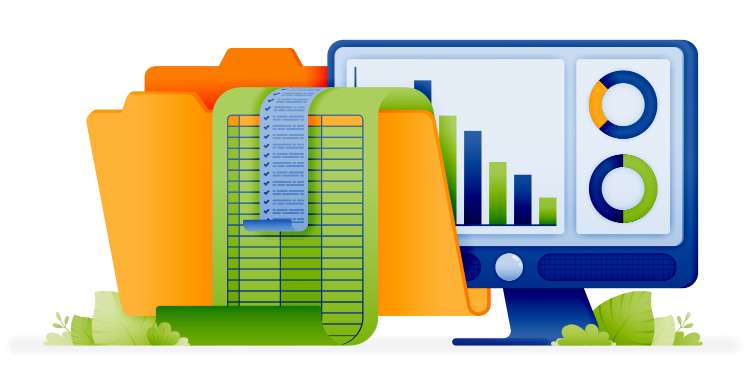
If you’ve ever viewed a report or infographic powered by Excel-generated graphics, you recognize that the time-tested spreadsheet application has some powerful tricks up its sleeve in terms of data visualization. Bar charts, pie charts, scatter plots, pivot tables, and more—Excel is packed with dynamic options for turning boring old numbers into vibrant depictions of current conditions and emerging trends. In effect, Excel allows you to tell persuasive and insightful stories through the data you have collected.
Those stories really come to life, however, when you transform that spreadsheet from Excel to a web app. Web apps enable authorized users to interact directly with the data, whether collecting and entering new information or viewing up-to-the minute graphics-rich reports. And they can do so from anywhere, on any device.
Transforming Excel into Dynamic Web Applications
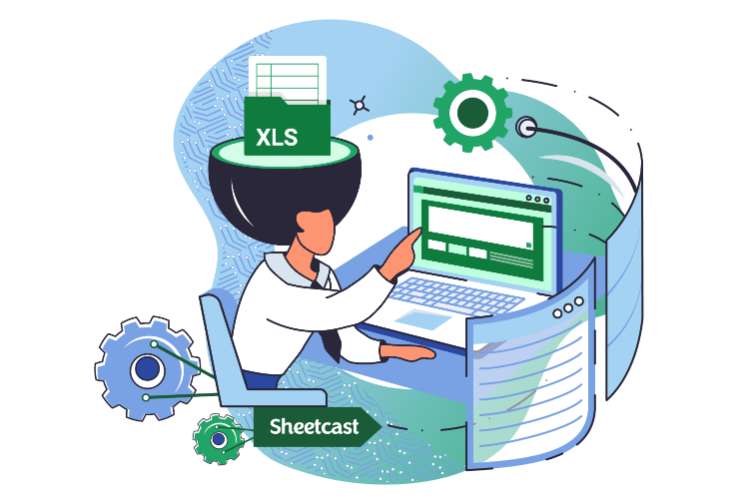
Sheetcast is the key element in this scenario. The patented new platform enables ordinary, non-technical users to convert Excel sheets to web applications in minutes.

After downloading the Sheetcast add-in, you upload the spreadsheet you’d like to convert from Excel to web application. Then, one by one, you add whatever pages and functions your users will need to input and display the data related to your spreadsheet. The demo videos at Sheetcast.com walk you through a few examples.
Once you have your own Sheetcast up and running, you can begin reaping the benefits of using visualization in web applications. For one, your users will no longer need to know Excel in order to work with your spreadsheet—indeed, they don’t even need to own a copy of Excel at all. Instead, they can interact with the data through simple, user-friendly forms and charts. And they can do so on any internet-connected device—a smartphone, tablet, laptop or desktop.
At the same time, a web app helps protect your intellectual property. When you share a spreadsheet, you also share the underlying structure and formulas that make it function. In other words, you’re trusting that your user won’t take your work and repurpose it—or even resell it—for their own benefit. A web app eliminates those concerns.
Enhancing Excel Data Visualization in Sheetcast

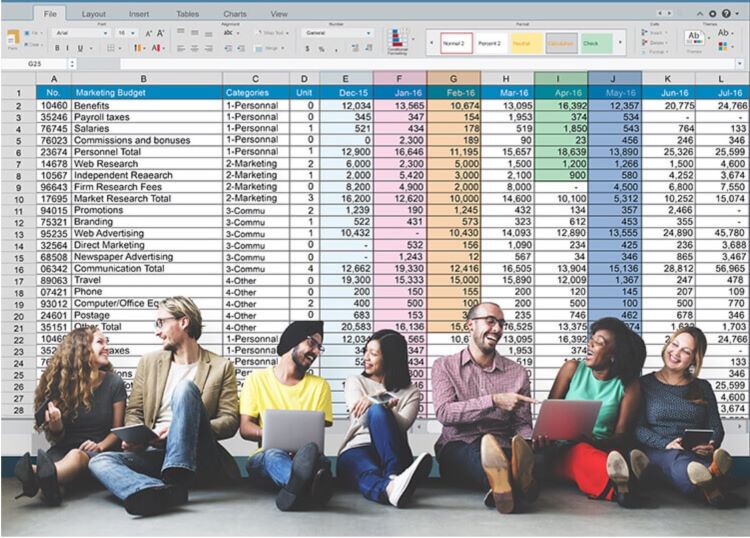
Data visualization in Excel has long been among the app’s most compelling strengths. With a few minutes and a bit of practice and expertise, any ordinary user can use Excel’s data visualization tools to transform rows and columns of raw data into vivid pie charts, bar graphs, line graphs, and more. Trends and patterns instantly emerge, communicating information otherwise buried under all those numbers. If a picture is worth a thousand words, it can be worth tens of thousands of Excel data cells.
Once you generate the visualizations, you have many ways to share them. You can paste them into a report for management, export them to a web page, send them in an email, etc. Of course, once you have shared them, those charts and graphs are only as current as the data behind them. As new numbers continue to roll in, those visualizations gradually become more and more outdated.
In a Sheetcast web app, you can turn Excel’s visualizations into dynamic, real-time depictions of your underlying data. When, say, a user at a remote work site pulls out their phone to enter data into the app, that new data is instantly reflected in the data visualization elsewhere on the app.
Interactive Data Presentation in Web Apps

Because Sheetcast data visualization relies on the types of charts in MS Excel, it’s essential that users gain a good understanding of Excel’s many creative ways to display data.
The first step is to select a chart type that best illustrates your data. Consider the nature of your data and the message you want to convey through your visualizations. Common types include Excel bar charts, line charts, pie charts, and scatter plots.
For a comprehensive understanding of how to display formulas in your worksheets, refer to our show formulas in Excel guide.
Where possible, keep things simple by removing clutter and unnecessary details. Choose a color scheme that is easy on the eyes but also effectively highlights important data points or categories. Clearly label your charts and any related axes and data points.
At the same time, take advantage of more advanced design options. Learn how to apply conditional formatting to highlight specific data points based on certain criteria. And utilize features like dropdown menus to allow users to interact with your charts.
Industry-Specific Data Visualization: Finance to Construction
Depending on the industry, data visualization can help guide understanding and decisions in many powerful ways.
In finance, for example, when you turn a spreadsheet into an app you can represent up-to-the-second financial trends, expense tracking, and trends in revenue growth using line charts and bar graphs. A scatter plot or bubble chart might help users analyze the performance of their investment portfolios.
Or in retail, you could create an app from an Excel spreadsheet to visualize sales trends, break down sales data to identify top-performing products, manage inventory, understand customer segmentation, and much more.
In construction, you could create a Gantt chart to help you visualize a project timeline, tracking progress against specified milestones. You could create a budget-vs.-actual chart to track project expenses, comparing initial estimates against actual spending over time.
In general, by leveraging Excel’s data visualization features and then turning a spreadsheet into an app, professionals in just about any industry can do a better job of tracking and analyzing their data in real time. Doing so will help them make more informed decisions and communicate complex information clearly and accessibly.
Security and Collaboration Features in Excel Web Apps

Truly dynamic data visualization is built on a foundation of collaboration. If you expect to leverage real-time data collection and analytics, you can’t rely on the old model of a single human updating and maintaining an Excel spreadsheet.
Excel users have long been able share workbooks, with multiple users collaborating on a single Excel file. More recently, with Office 365, the practice evolved into co-authoring. Co-authoring enables people to make simultaneous additions and changes to the same Excel web file at the same time—even observing other people’s edits as they’re made, with each collaborator’s cursor displayed in its own color.
When it comes to Excel spreadsheets, however, collaboration has its pitfalls. Co-authoring essentially grants everyone access to the spreadsheet’s structure and underlying formulas. If people don’t stay in their lanes, working only how and where they’re authorized, they can end up breaking a spreadsheet. You might also end up exposing more of your intellectual property than you’d like.
When users collaborate on data through a web app, however, your underlying spreadsheet remains secure and out of sight. You can collect and analyze data, and share your data visualizations, without giving anyone else the opportunity to meddle with your workbook.
The Future of Data Analysis: Excel as a Web App
By creating an accessible, affordable way to create an app from an Excel spreadsheet, Sheetcast has potentially altered the future of the custom software sector—especially when it comes to data analysis.
For decades, custom software has been largely restricted to large organizations with deep pockets and long timelines. The development process can take months and cost tens or even hundreds of thousands of dollars.
With Sheetcast, you can create an app from Excel yourself in minutes or hours and have it up and running immediately. Depending on its size and the number of users, a Sheetcast web app can cost as little as a few dollars per month. In other words, custom software delivering real-time dynamic data visualization is suddenly now an option for anybody.
Discover the Ease of Sheetcast: Your Path to Professional Web Apps
It’s one thing to talk about the transformative value of custom software when it comes to collecting, analyzing, and visualizing data. It’s another thing to see it in action. Download and install one Excel add-in, and any ordinary Excel user can immediately begin designing and deploying their own custom apps.
When new users get their first walk-through with Sheetcast, they invariably begin to think of potential uses. Advanced workflow automation. Detailed, real-time graphic report pages, displayed on the web or delivered in emailed PDFs. Online surveys with instantly updated result charts. The possibilities are limited only by users’ imaginations.
Start Your Journey with Sheetcast Today

Take data visualization to the next level by using Sheetcast to create dynamic web apps to collaborate on your data, and share the results and trends while they’re still emerging.
Assuming you already have a working knowledge of Excel, there’s no reason why you can’t become a custom web designer with Sheetcast. Visit the website for product videos and an interactive demo and then download the add-in for yourself.
Excel has changed the way the world gathers and processes data. Now, Sheetcast is changing the way the world uses Excel.