The Global Excel Summit is a yearly 3-day conference focused on Microsoft Excel and related technologies. It is organized by Datel Productions Limited and offers two experiences: in-person and online. In 2025, the in-person experience happened at the Soho Place Theatre, a spectacular venue in London, UK, with a beautiful multilevel theater set up around a circular stage and other spaces for the networking moments. The conferences presented in the first two days were delivered from the Soho Theatre stage and broadcasted live to those attending remotely. The third day, called the Community Day, was exclusively delivered online and was free for anyone to attend. The Global Excel Summit had its 5th edition in 2025 and has become a world reference in the Excel business industry. This event brings together several stakeholders from the Excel world - Excel Experts, professionals from all kinds of industries who use spreadsheets in their work, trainers, content creators and companies who develop software that extends Excel’s capabilities - and it offers something for everyone.

What’s new in Excel?
The Global Excel Summit is an opportunity to get updated with the newly available features in Excel. Not all professionals using Excel make the time and effort necessary to stay on top of improvements made to Excel. After all, it is not easy to keep up with all the new additions given the fast pace in which this tool has evolved.
By attending events like the Global Excel Summit, you can get an overview of the new features and improvements introduced in Excel over the past year and how to leverage them at work.

Leila Gharani went through some of the most recent additions to Excel and she covered new features like Focus Cell and True Dark Mode, the new TRIMRANGE function and operator, the Regular Expression functions REGEXEXTRACT, REGEXREPLACE and REGEXTEST, the new GROUPBY and PIVOTBY functions, and Python in Excel which is natively now available in Excel with the capability to read data brought into the file with Power Query. Leila also mentioned the new Checkboxes feature, the TRANSLATE function and Copilot.
What’s coming up next?

Not only do you get a summary of what’s new, but you’ll also get an insider look at what’s next—so you can stay ahead of the curve. Chris Webb, a member of the Fabric Customer Advisory Team at Microsoft, came to talk about how Power BI, Fabric and Excel fit together to boost productivity for any company size, but the most spectacular revelation from Chris to the Excel crowd might have been the one about Power Query’s editing capabilities coming soon to Excel for the Web. This new addition will certainly open new ways of developing solutions in Excel online.
AI and Copilot
One of the greatest investments by Microsoft in the recent past has been on AI, with Copilot being the tool integrating AI in Microsoft's applications. Several speakers covered Copilot’s capabilities.
David Fortin gave examples of how to take advantage of Copilot, including asking Copilot to create Excel formulas to solve a specific example, create charts from data provided and transcribe handwritten data into a spreadsheet.
While some features require the pro version, others are available to you for free.
Using AI is a requirement for everyone to stay on top of productivity. Even if you are an expert, it becomes critical to learn how to provide Copilot with prompts that will make it generate the desired results and use this help to do your work faster.
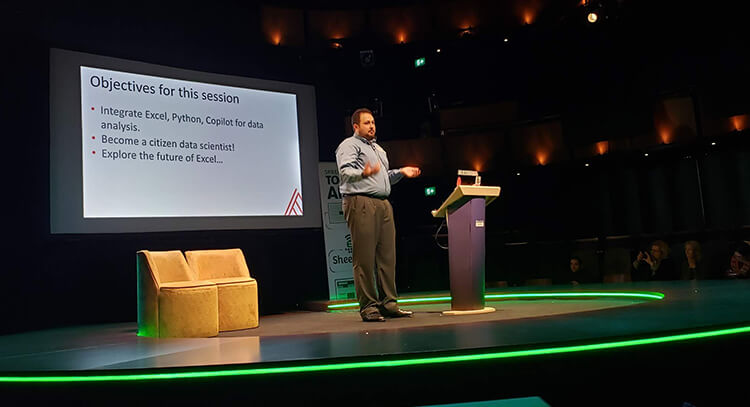
George Mount talked about how Copilot and Python, now available from within Excel, can boost not only the professional’s productivity but also the type of outputs that can now be generated in Excel that were not possible, or at least were not easy, to accomplish before. George also showed a couple of use case scenarios for using Python in Excel and how using Python and Copilot together in Excel can allow users to uplevel their data analysis game.
Financial Modelling

Several presentations were geared towards financial modellers. Gary Knott talked about cash flow methods in Excel. Liam Bastick played “Deal or no deal” to discuss best practice modelling tips. Danielle Stein Fairhurst showed us how to take advantage of PowerPoint for financial presentations. Ian Schnoor and Rob Langrick shared their best techniques to solve disparate practical problems faced by finance professionals as they model company cashflows and valuations. Ian taught several steps to incorporate when exploring a file for auditing purposes that will help find errors and irregularities in those models. Ian and Rob also talked about the job roles in the Finance industry and how Excel is the go-to tool across several mathematical areas like monitoring and risk analysis for example.
Best Practices

Best practices when working with Excel and Power BI is a big topic for data analysts and anyone building reports and developing solutions for others to use. Carlos Barbosa showed how some very “basic” skills like filtering and sorting are fundamental for a first approach to get to know the data you are dealing with on a project. After this preliminary investigation, the Excel professional should know if the data available can be trusted and the parameters and parameter ranges involved in the project. Then, when data is ready for analysis, Carlos presented Pivot Tables as one of the powerful tools available in Excel for data aggregation and summarization. All this will work even better and more dynamically if we use Excel Tables. He also reinforced how important it is to cross-check your data and confirm your report results.
Carlos’s presentation was also about how to bring Excel and Power BI together to take advantage of the best each tool has to offer, and demonstrated how some tasks can be accomplished with both tools.
Data Models

Data Models are fundamental for analysis and automation processes that involve multiple tables or data collected from multiple sources. You can work with Data Models in both Excel and Power BI. In both programs, it is important to understand what a data model is, how to structure one by correctly creating relationships between the several tables and how to create the measures that will be used for analysis. Before all this, data must be imported, properly cleaned up and set up in tabular layout. Power Pivot, DAX and Power Query are the tools to learn if you want or need to work with data models in Excel or Power BI.
Carolina Lago talked about the importance of creating a single source of truth for your financial data and reporting, and suggested starting with Power Pivot in Excel to build your first data model and dashboard, combining and analyzing data from multiple sources. Carolina demonstrated how to use Power Query, Power Pivot and DAX to create a data model in Excel. Carolina also explained why she recommends starting with Excel for your first data models and went over the scenarios where you may need to move from Excel to other technologies.
Power Query

Power Query is useful for anyone dealing with data that requires layout changes before it can be consumed, regardless of being a one-time or recurring task. Power Query can import data from multiple sources and load the resulting tables into an Excel table or into a data model. Maria Braga presented an introduction to Power Query and how to use it to automate your data importation procedures to update your reports. Power Query is extremely powerful because it can reduce drastically the time spent in cleaning and preparing data for reporting. And if you’re handling recurring tasks, those time savings become even more valuable..
When progressing in problem solving complexity using Power Query, dealing with the M language becomes inevitable. When we need to use M functions that are not available in the user interface or want to optimize queries for faster refreshing, the only way is to dive into Power Query’s advanced editor and work with the code. Melissa De Korte talked about how to debug, solve and avoid the most common errors in Power Query.
Important to note that Power Query is available also in Power BI and other Microsoft programs and platforms.
DAX

DAX is part of both Excel and Power BI, and it is the language that allows us to create custom measures in Power Pivot in Excel to then use in pivot tables for our reports.. Chandeep Chhabra gave an entertaining presentation on the CONCATENEX function showing us how to evolve in detail using that function to achieve different results. Chandeep won the award for the best in-person presentation.

Power BI

If you read this article until now, you already saw Power BI mentioned a few times. Power BI is one of the natural progressions from Excel to scale reports and make them available to several stakeholders, ensuring each person only gets access to the data their credentials allow them to. The integration of Power BI with other Microsoft tools like Teams, Power Apps, and Excel create a whole new world of possibilities for how data is made available and consumed.
Gustaw Dudek guided us through his recommendations related to the creation of dashboard mockups during the requirements gathering and testing processes of a project, to then transform them into beautiful and efficient dashboards.
Charts

Power BI dashboards are attractive and mindblowing. Interactivity capability is one of the first things that make these dashboards so interesting and useful, along with other Power BI characteristics like the ability to share reports with different levels of access by user. However, Power BI may not always be accessible to all the teams - lack of knowledge and cost could be two of the reasons. Chandoo explains that the core functionality that exists in Power BI to allow for chart interactivity, also exists in Excel, and since Excel is a tool with which most users are more familiar, and it does not require any extra license other than a regular Microsoft license, knowing how to add extra interactivity to the “regular” Excel charts, can be the way to go in some scenarios.
Chandoo exemplified how to create that interactivity on a bar chart in a one step-by-step example. The solution involves loading the data to the data model, using Power Pivot to create the necessary custom measures, creating Power Pivot Tables and applying slicers to those. All these steps may seem a lot to learn for a beginner, but these are the same things that a Power BI developer needs to know to create a reporting solution from scratch.
By using several chart settings in Excel, Chandoo showed how to create the same visual result that we get on Power BI where, when we filter, we still see the representation of the total values represented by transparent columns.
Chandoo also showed the behind-the-scenes techniques that he used to create other interactive visuals in Excel. These involved conditional formatting, in-cell checkboxes and several functions, including dynamic array functions like GROUPBY, FILTER, CHOOSECOLS, MAP and LAMBDA.
Charts are useful for decision makers because they can represent data visually and convey a story, or help detect patterns or values outside the norm in a much faster way than when looking through the numbers only.
Anyone in a role involving data analysis, almost certainly will need to create charts. The important thing to understand is that a lot of work might be needed before the data is ready for chart building. As per Chandoo’s example, we see that building a chart is not just about picking the chart type we want and clicking a couple of buttons. It is about knowing how to clean the data with Power Query first, and then knowing what a data model is and how to build one in Power Pivot, knowing enough of DAX to build the necessary measures, and then bringing Excel functions and features together to achieve the visual effect intended.
Sessions like Chandoo’s presentation provide the big picture to those who are still at the beginning of their learning journey in Excel, showing them the different learning directions they may need to look into to evolve their skills. This session also highlights the power of Excel and the things one can achieve with it when we are knowledgeable and get creative.
Dynamic Array Functions

Dynamic Array Functions and the changes on the Excel engine that allow most classic functions to work with dynamic arrays, make calculations and reporting in Excel much more powerful and dynamic than before. LET and LAMBDA along with all the other new functions open a whole new world of possibilities for analysts and solution developers.
Diarmuid Early explained how we can create our custom functions with LET and LAMBDA. Before we had to use VBA to create custom functions in Excel. With LET and LAMBDA we can now create custom functions that are easily shareable and work in Excel online.
Alan Murray proposed that we “ditch” pivot tables in favour of the functions GROUPBY and PIVOTBY to aggregate data and report. These functions allow for automatic report updating without the need for refreshing that pivot tables require. And by combining GROUPBY and PIVOTBY with other functions and Excel features like checkboxes, data validation, custom formatting, filters and slicers, we can develop very interesting and dynamic Excel solutions.
Automation in / with Excel

Automation is the drive of today’s efficiency and productivity. VBA was for many years the go-to language for programming in Excel (and the other Microsoft applications.) It is still quite used today, but with the rise of moving data and files to the cloud, and the issue of security posed by malintended-actors using VBA, Microsoft has been making other languages and technologies available to address the challenges that VBA cannot handle.
Bob Umlas showed how to create a wizard using VBA. Mark Proctor talked about how to combine Power Automate and Office Scripts with Excel to achieve the dream of automating a procedure without having to click one single button.
Power Automate runs a flow of steps based on a trigger. Some examples of triggers, among many others, are receiving an email, creating a file in a folder and submitting a form. When a defined trigger action happens, the flow will run automatically. Office Scripts is a programming language primarily based on TypeScript, which is a superset of JavaScript. Office Scripts run online, and therefore allow for automation in some scenarios that VBA does not.
What else can Excel do?

Using Excel just for fun was Richard Sumner’s proposal. He showed things he has built in Excel just because it makes him feel relaxed. Pixel art, calculations for game scoring, plotting locations on a map, clocks and unusual charts, board games and sport games simulators, strategy games, and learning games for children were some of the examples. Richard invited Excel professionals to push Excel’s boundaries, be creative and not be afraid to try new things. He promises that by doing so, one will learn new techniques that will become useful when working in a business case scenario later on.
Networking Opportunities

Besides the opportunity to meet some of the Excel Experts you have been following and learning from, you will be able to connect with other professionals from your business industry and different ones, and will get to know how people use Excel in different ways than yours. It can be a great opportunity to expand your network and perhaps uplevel your career. If not for anything else, you will certainly have fun connecting with other like-minded professionals at the event. Networking spaces and dedicated time frames are available for both the in-person and the online experiences of the event.
Other technologies available to expand your work and results in Excel
The Global Excel Summit brings together many different players of the Excel industry. This event is also an opportunity to learn about other tools available on the market that allow you to expand your Excel knowledge, skills and results.

That was the case with Sheetcast, the lead sponsor of the event. Celia Alves showed how, with the Sheetcast add-in, you can turn your everyday Excel workbook into a powerful, secure, and fully functional web app—no coding required.
Who should attend the event?

As you can see, The Global Excel Summit has something for anyone using Excel and interested in expanding their skills.
Data analysts, business analysts, accountants, bookkeepers, office administrators, project managers, financial analysts and other finance professionals, marketing analysts, sales managers, operations managers, human resources analysts and managers, supply chain analysts, administrative assistants, research analysts, investment bankers, budget analysts, customer service managers, logistics coordinators, procurement specialists, quality assurance analysts, real estate analysts and risk managers are only a few of the roles who could benefit from attending a spectacular event like this one.