This article will cover how to make a diagram in Excel, and then explain how to do it quicker, easier, and more consistently with Turbo Diagrams!
How to Create a Tree Diagram in Excel
Step 1. Go to the Insert tab in Excel.
Step 2. Click "Shapes" and select the desired flowchart node shape.
Step 3. Draw the shapes onto the sheet by clicking and dragging.
Step 4. Double click a shape to add text to it.
Step 5. Select the "Line" or "Arrow" shapes from the "Shapes" tab, and draw from one node to another, creating connection between the two.
Step 6. Determine formatting for each added element of the diagram on the "Home" tab.
Why Shouldn't You Use This Method?
| Feature | Standard Excel Approach | Turbo Diagram (Free Tool) |
|---|---|---|
| Ease of Use | Manual and time-consuming; requires inserting and aligning shapes and connectors individually | Automated – just input data into a table and click a button |
| Accuracy | High risk of misalignment, inconsistent spacing, and formatting issues | Precise layout generated automatically, consistent formatting |
| Speed | Slow – each node and connector must be placed and labeled by hand | Instant – generates full diagram from structured data in seconds |
| Customization | Limited formatting tools; requires manual updates to make changes | Edit data in Excel table to update nodes, colors, connections |
| Learning Curve | High – requires Excel shape and layout experience | Low – no design skills needed; template guides you step by step |
| Scalability | Difficult to manage when diagram grows large | Easily handles large, complex tree structures |
| Cost | Free (but time-intensive and manual) | 100% Free, no signup or subscription |
When you draw a Tree Diagram in Excel, the process out of the box is both highly time consuming and prone to human (and sometimes technical) error, especially for users that are not experts in using Excel as a design tool for business, education, or data analysis. Luckily, there is an add-on that can make this process a triviality, allowing you to make diagrams easily using Excel!
Turbo Diagrams: A Better Way to Build Diagrams Automatically in Excel
What is it?
Turbo Diagrams is an easy-to-use tool that makes creating diagrams simple in Excel, taking data tailored by you and turning it into a fully functional diagram!
How to Use Turbo Diagrams
Enable the Tool
Download Turbo Diagrams and run the installer. Relaunch Excel and select Actions, and then Modules, from the Tools menu as shown in the image below.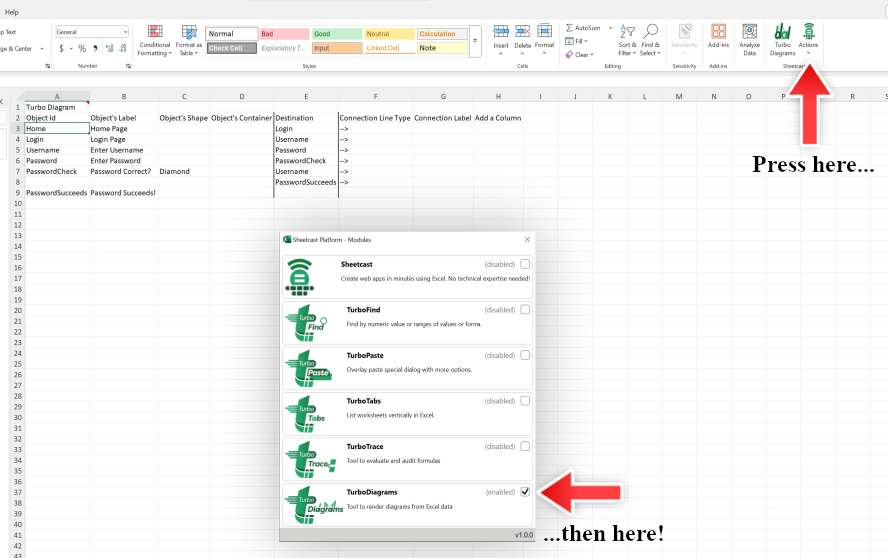
Edit Your Diagram's Data
Using the template that is generated easily and automatically for you, edit the data in the fields to customize the output of the diagram.
Object ID: The unique ID associated with the node in the diagram.
Object's Label: The text to appear on that node.
Object's Shape: The shape of the node.
Object's Container: Adds a container to a group of nodes, grouping them visually.
Destination: The Object IDs that the node should flow to (separated by additional rows).
Connection Line Type: Style of the line to be drawn from the node to the Destination's node.
Connection Label: The text (if any) to display on the connection line to the Destination node.
Object's Styling: The hexadecimal code of the desired color of the node.
Connection Styling: The hexadecimal code of the desired color of the connection line to a Destination node.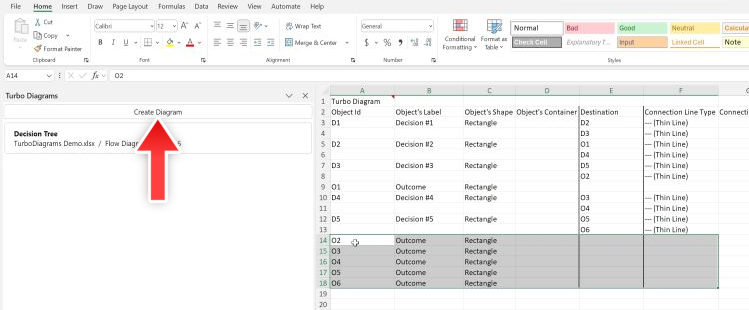
A link to easy-to-use hexadecimal color pickers can be found at the link here .
Click the Create Diagram Button
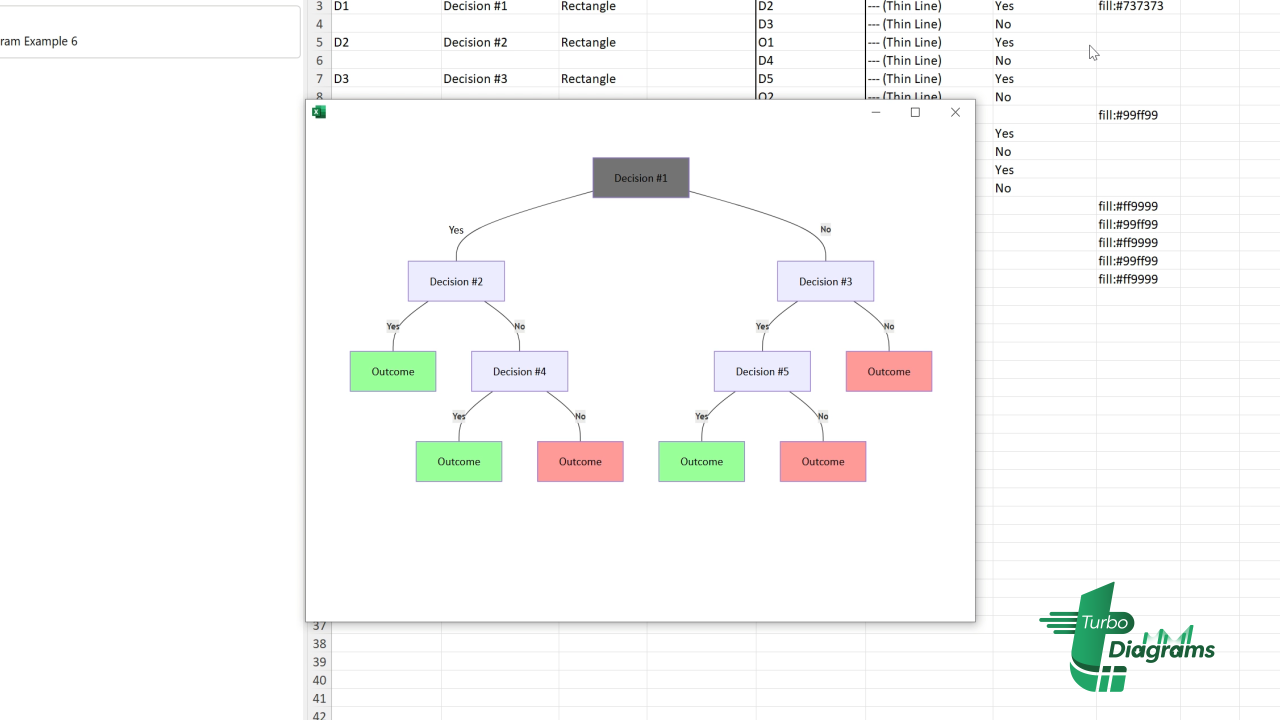
When the data is ready, click the Create Diagram button in the menu on the left, and watch as the software creates a diagram out of the data that you entered! 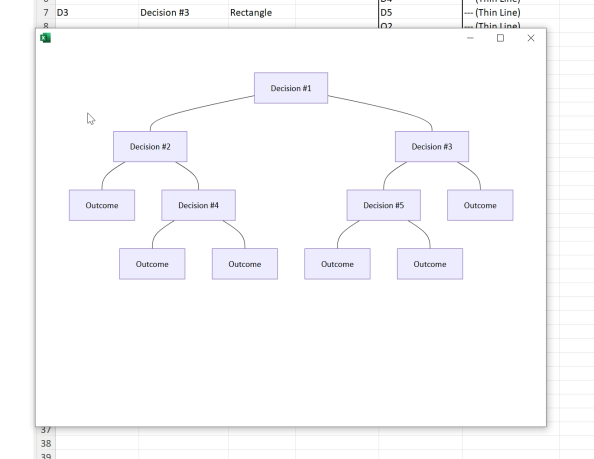
This diagram can be exported, or edited and customized by changing the data in Excel.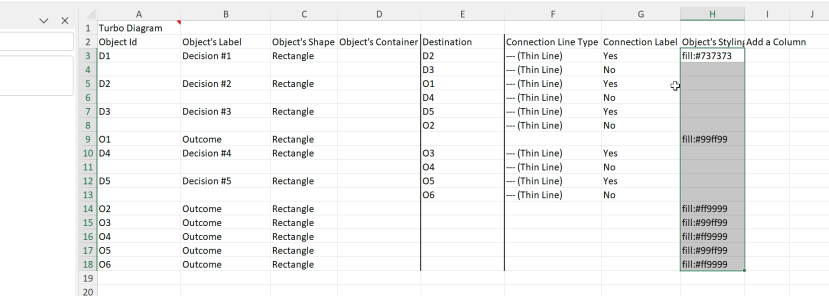
Key Takeaways
While Excel is technically capable of creating diagrams, the method for doing so is time consuming and difficult for users that are not deeply ingrained in Excel's infrastructure. Turbo Diagrams makes creating diagrams in Excel quick, easy, and intuitive, with the ability to transform your data directly to an editable and exportable chart!
If your diagram is based on calculated data, it may be helpful to first review your spreadsheet logic — here’s a quick guide on how to show formulas in Excel using our free Turbo Trace tool.
Frequently Asked Questions (FAQ)
Is Turbo Diagrams easy to install? Do I need any special setup?
Yes, it is very easy to install! Simply download it from our website, follow the installation steps, and you’re ready to go, no special setup needed!
How much does it cost?
It is completely free to download and use, with no hidden fees or subscriptions!
Does the software work on both Windows and Mac versions of Excel?
The software is optimized for Windows. For Mac compatibility, please check the system requirements on our download page.
Can I use Turbo Diagrams alongside other Turbo Tools?
Absolutely! The full range of Turbo Tools are designed to work independently, so you can use it alongside others without any conflicts.
Where can I get support if I have questions or issues?
For any questions or issues, please visit our support page or contact our helpdesk. We’re here to help!